Clearance CLR-4802 · AIR921
AIRATL
AirportsClearance sheet
Atlanta Holds North America’s Busiest Airport Lead in 2025
Hartsfield-Jackson handled 106.3 million passengers in 2025, retaining North America’s top airport position despite a 1.6% decline and Chicago O’Hare’s 6% growth.
Read-back
- Hartsfield-Jackson handled 106.3 million passengers in 2025, down 1.6%, and remained the world’s busiest airport.
- Dallas Fort Worth ranked second with 85.7 million passengers; Chicago O’Hare ranked third with 84.9 million.
- Atlanta’s lead over Dallas Fort Worth exceeded 20 million passengers.
- O’Hare posted the strongest top-10 growth at 6%; Harry Reid had the largest decline at 5.9%.
- All 10 leading airports were in the US; Toronto Pearson’s 47.2 million trailed San Francisco’s 54.5 million at No. 10.
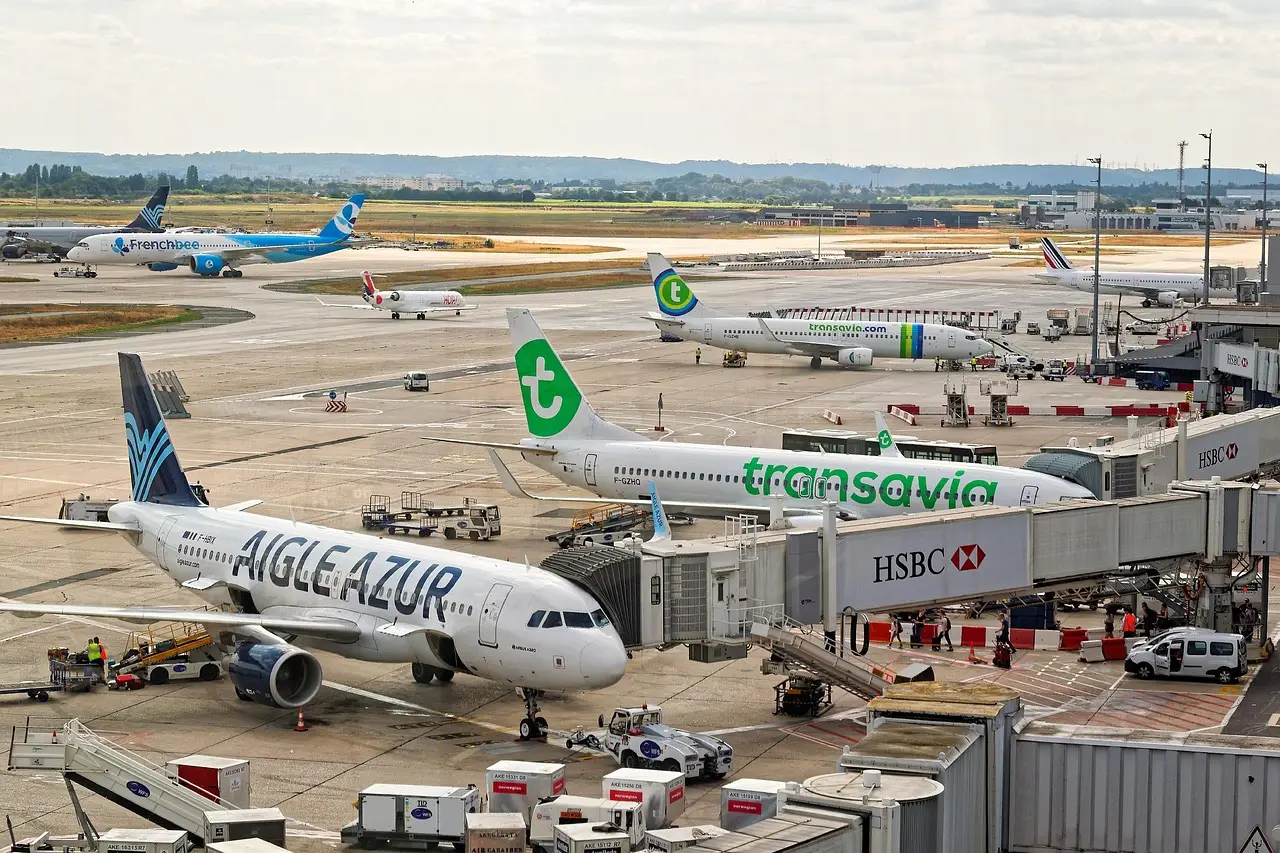
Hartsfield-Jackson Atlanta International Airport handled 106.3 million passengers in 2025. The total kept it North America’s busiest airport for another year and preserved its standing as the world’s busiest by passenger volume, even though traffic slipped 1.6%.
Visual Capitalist’s new ranking draws on Airports Council International data. It places Dallas Fort Worth International Airport second with 85.7 million passengers and Chicago O’Hare International Airport third with 84.9 million. Denver International Airport and Los Angeles International Airport follow in fourth and fifth places.
What does the 2025 leaderboard show?
The published table includes:
- Hartsfield-Jackson Atlanta International Airport — No. 1, 106.3 million passengers, down 1.6%.
- Dallas Fort Worth International Airport — No. 2, 85.7 million passengers.
- Chicago O’Hare International Airport — No. 3, 84.9 million passengers, up 6%.
- Denver International Airport — No. 4.
- Los Angeles International Airport — No. 5.
- San Francisco International Airport — No. 10, 54.5 million passengers.
Atlanta outpaced second-place Dallas Fort Worth by more than 20 million passengers. That margin, rather than its 1.6% decline, decided the top of the table because the ranking measures total passengers rather than rates of change.
All 10 airports on the list sit in the United States. No Canadian or Mexican airport made the cut, even though Toronto Pearson International Airport, Canada’s busiest, handled 47.2 million passengers. Pearson finished below 10th-place San Francisco International Airport, which handled 54.5 million. Visual Capitalist publishes the complete passenger totals and year-over-year changes in the full ranking.
How strong was Chicago’s growth?
Chicago O’Hare recorded the strongest year-over-year passenger growth among the top 10, rising 6%. On the published totals, its 84.9 million passengers placed it 800,000 behind Dallas Fort Worth, whose 85.7 million put the airport second.
The rate and the total tell different stories. O’Hare added passengers faster than any other airport in the leading group, while Dallas Fort Worth remained more than 20 million passengers behind Atlanta. For airport and airline planners, sustained growth of that scale can put more pressure on terminal, gate and connection capacity if passenger handling continues to rise.
The ranking does not show whether O’Hare’s gain came from more flights, larger aircraft, new routes or stronger demand on existing services. Without aircraft movements, load factors or delay performance, the 6% increase cannot be translated into gate demand, schedule changes or airline cost. It establishes the scale of traffic growth, not its operational cause.
Why did Atlanta stay first while traffic fell?
Atlanta’s 1.6% decline did not erase its scale advantage. A ranking built on absolute passenger throughput lets a large airport retain first place while its traffic moves in the opposite direction from the rest of the market. Here, Chicago grew 6%, Las Vegas fell 5.9%, and Atlanta slipped 1.6% but still ended more than 20 million passengers clear of Dallas Fort Worth.
That position gives Atlanta a substantial buffer. On the published 2025 totals, it would have to lose 20.6 million passengers to draw level with an unchanged Dallas Fort Worth result. If O’Hare sustains faster growth while Atlanta continues to decline, the battle for second place could tighten.
The counterpoint is that a falling passenger total can still matter operationally. A sustained decline would leave fewer travelers to feed connecting banks and could change airlines’ frequency and aircraft-gauge decisions. The source provides no airline schedule or network data, so it cannot show whether Atlanta saw fewer domestic and international connections, fewer frequencies or a shift toward larger aircraft.
Why did Toronto Pearson miss the top 10?
Toronto Pearson’s 47.2 million passengers made it Canada’s busiest airport, but that total remained below San Francisco’s 54.5 million at No. 10. The comparison shows why Pearson missed the list: Canada’s busiest airport remained below the threshold occupied by 10th-place San Francisco.
The ranking therefore measures concentration as much as national market size. It does not say Canada or Mexico lacked busy airports; it says none reached the passenger totals recorded for the 10 U.S. facilities in the leading group.
What changed at Las Vegas?
Harry Reid International Airport in Las Vegas posted the largest year-over-year decline among the top 10, falling 5.9%. Its position remains inside the group despite the drop, but the direction contrasts with O’Hare’s 6% increase.
For airlines and airports, traffic growth can support connecting demand and justify additional flying, while a prolonged decline can remove demand from a schedule. Neither consequence follows automatically from one annual percentage. The available figures do not reveal how many flights operated at Harry Reid, how much capacity airlines cut or whether fares and routes changed.
The broader question is whether these shifts were one-year movements or the start of sustained network changes. The next ACI-based comparison will show whether Atlanta reverses its 1.6% decline, whether O’Hare extends its 6% growth and whether Las Vegas recovers from its 5.9% fall.
via Aviation Pros (Source)
More from Nathan Brooks
Show full bio
Correspondent covering technology and product news in Commercial aviation industry coverage at Flightdeck Report.
589 articles
Same bay
- FDR554Airport Capital Programs Deliver Measurable Passenger Satisfaction Gains · September 30, 2026
- FDR353Dubai's Al Maktoum Airport: $35bn Expansion Targets World's Biggest Hub · October 9, 2026
- FDR505American Airlines Adds 14 New Routes From Dallas-Fort Worth · September 30, 2026
- FDR701Avelo Adds Denver and Three More Routes From McKinney · September 30, 2026
- FDR225Istanbul Takes OAG Connectivity Crown as Dubai Slips to 31st · October 10, 2026